Posts gallery

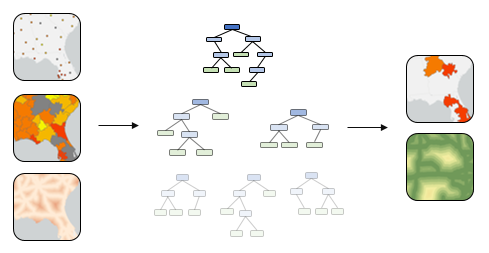
Supervised Image Classification with Random Forest in R
In this post, I demonstrate how to load and visualize georeferenced spatial data and perform a supervised random forest classification using R.

Animal species records history in the Atlantic Forest
This was my final project for the course "Introduction to Infographics and Data Visualization".

Homeless in New York State
This was my second project for the course "Introduction to Infographics and Data Visualization".

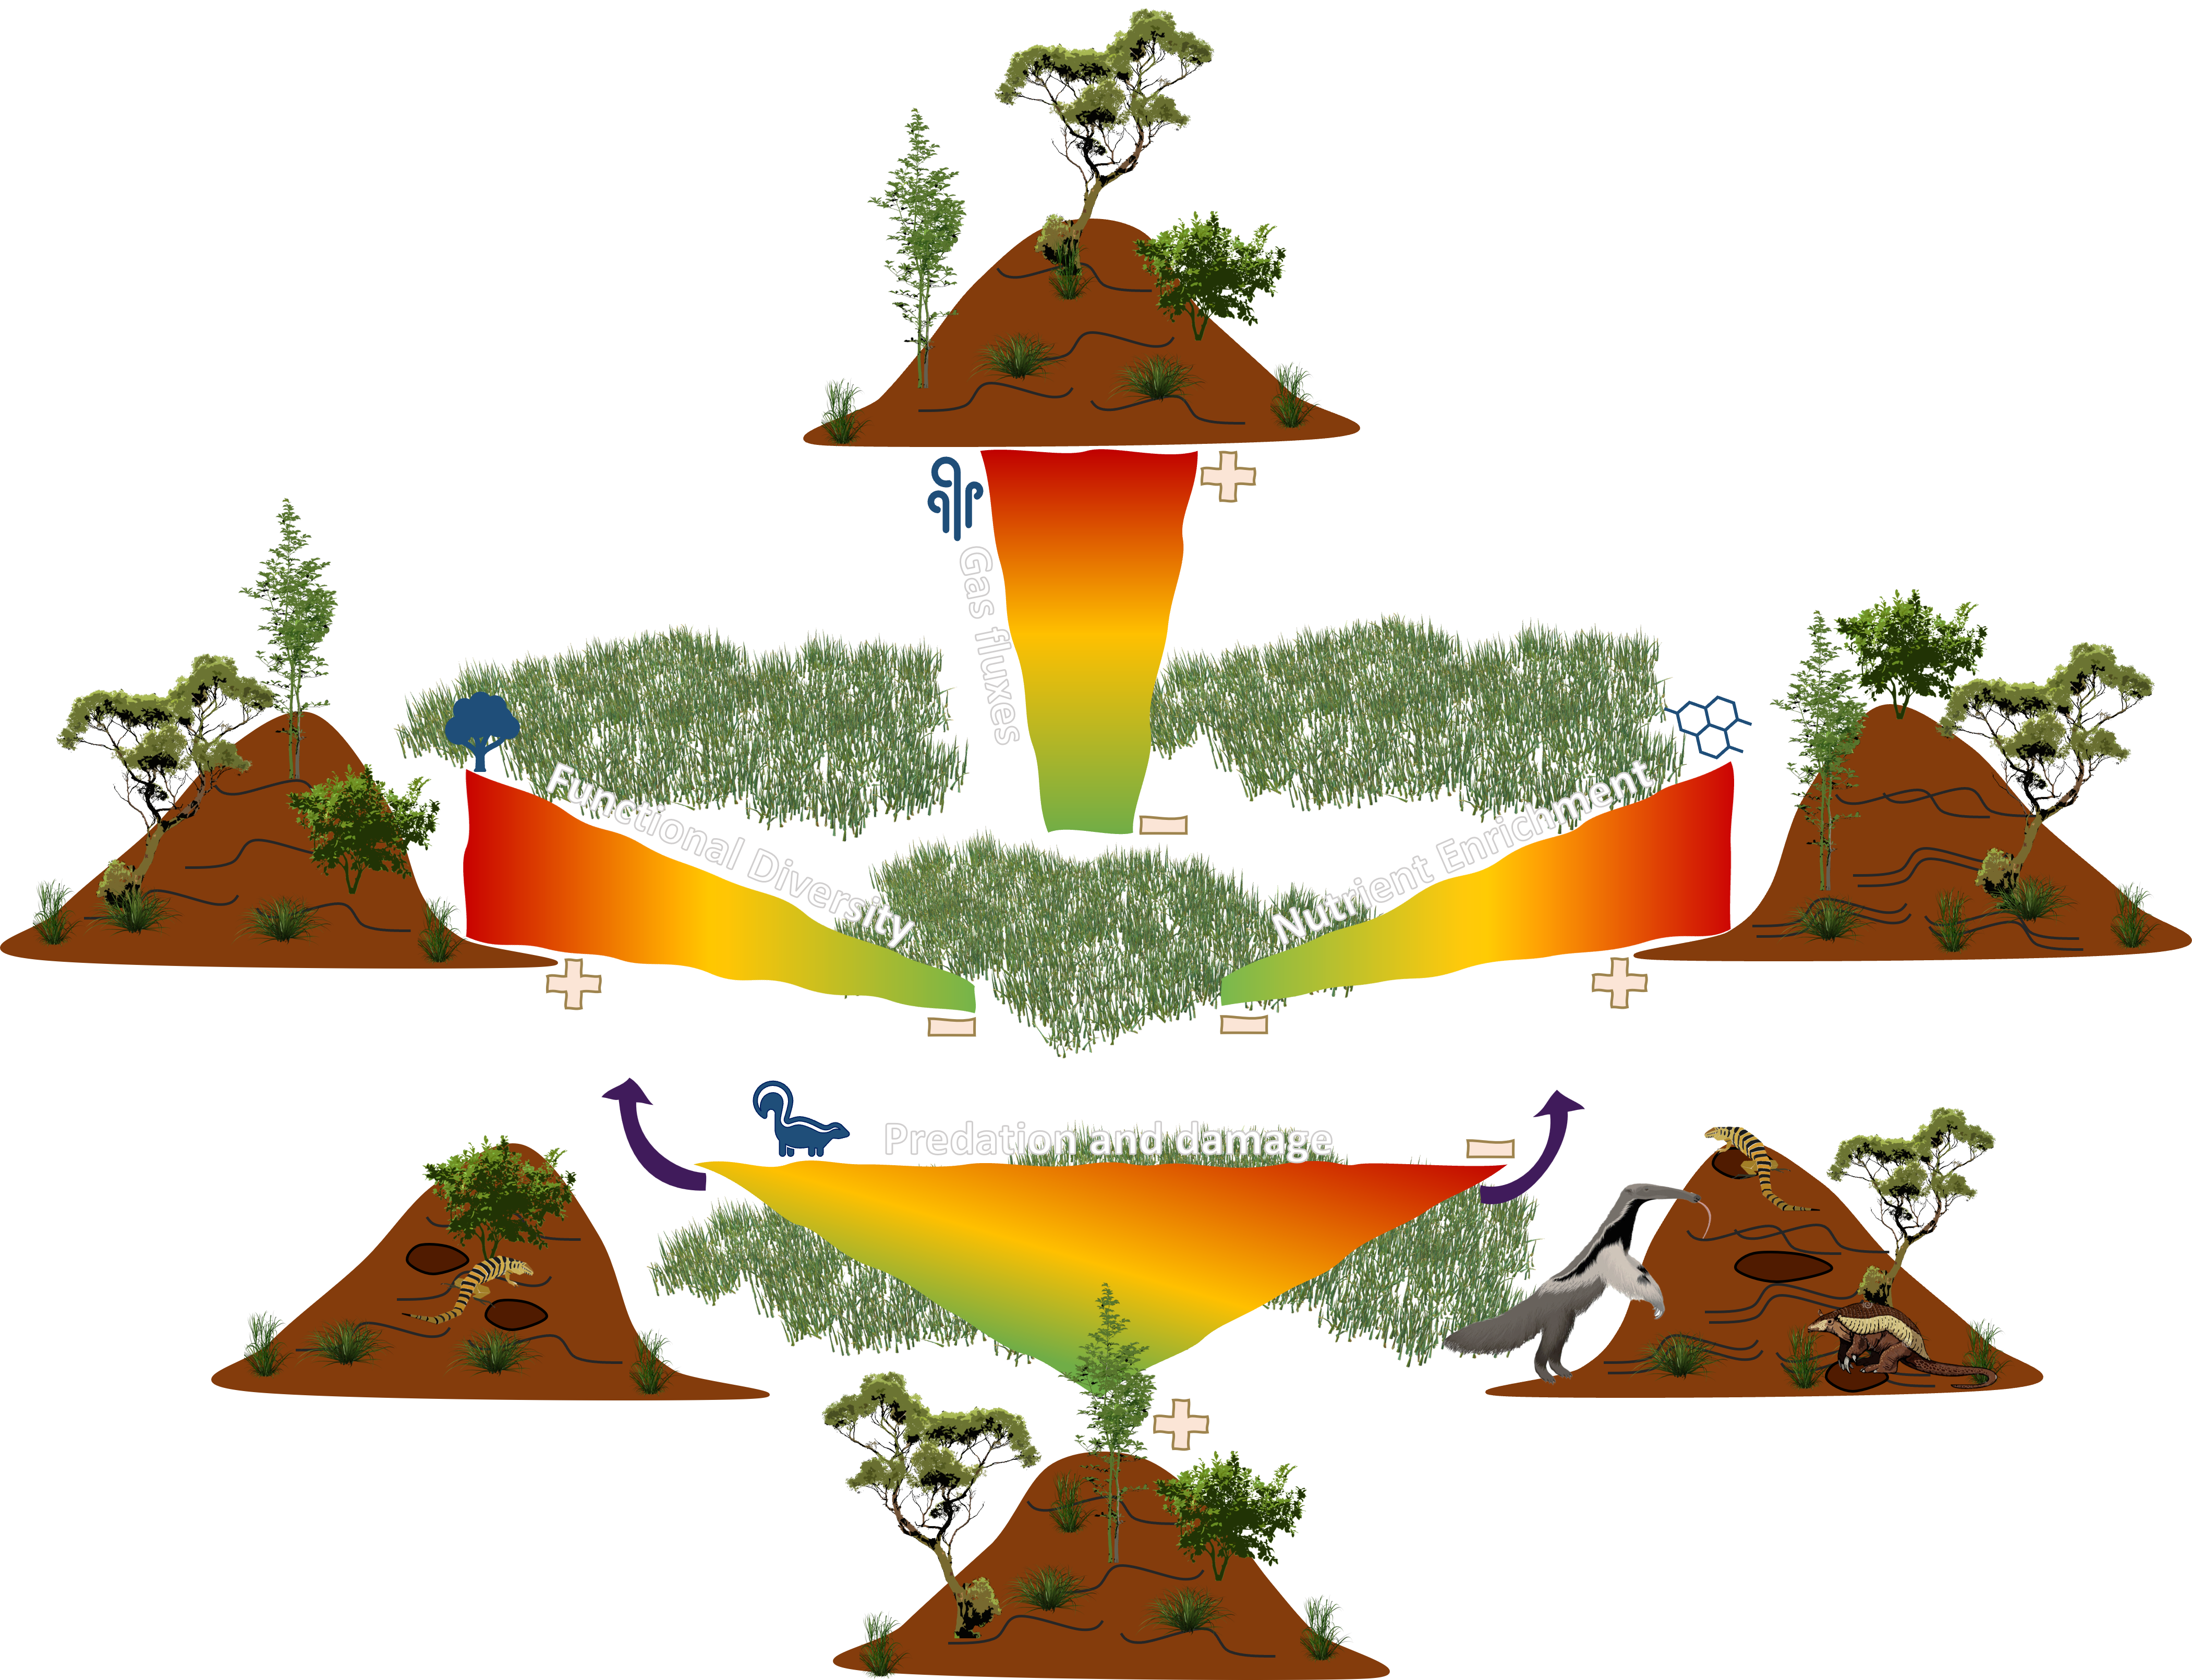
Murundus: hotspots of biodiversity, nutrient enrichment, and gas fluxes through termite activity
This poster was presented on the University of Miami Graduate Student Symposium 2023
Termites’ role as promoters of soil nutrient composition and gas flux in the Brazilian Savanna
This poster was presented on the 6th Climate and Health symposium

Building my 3rd ShinyApp
This was my third experience building a ShinyApp.

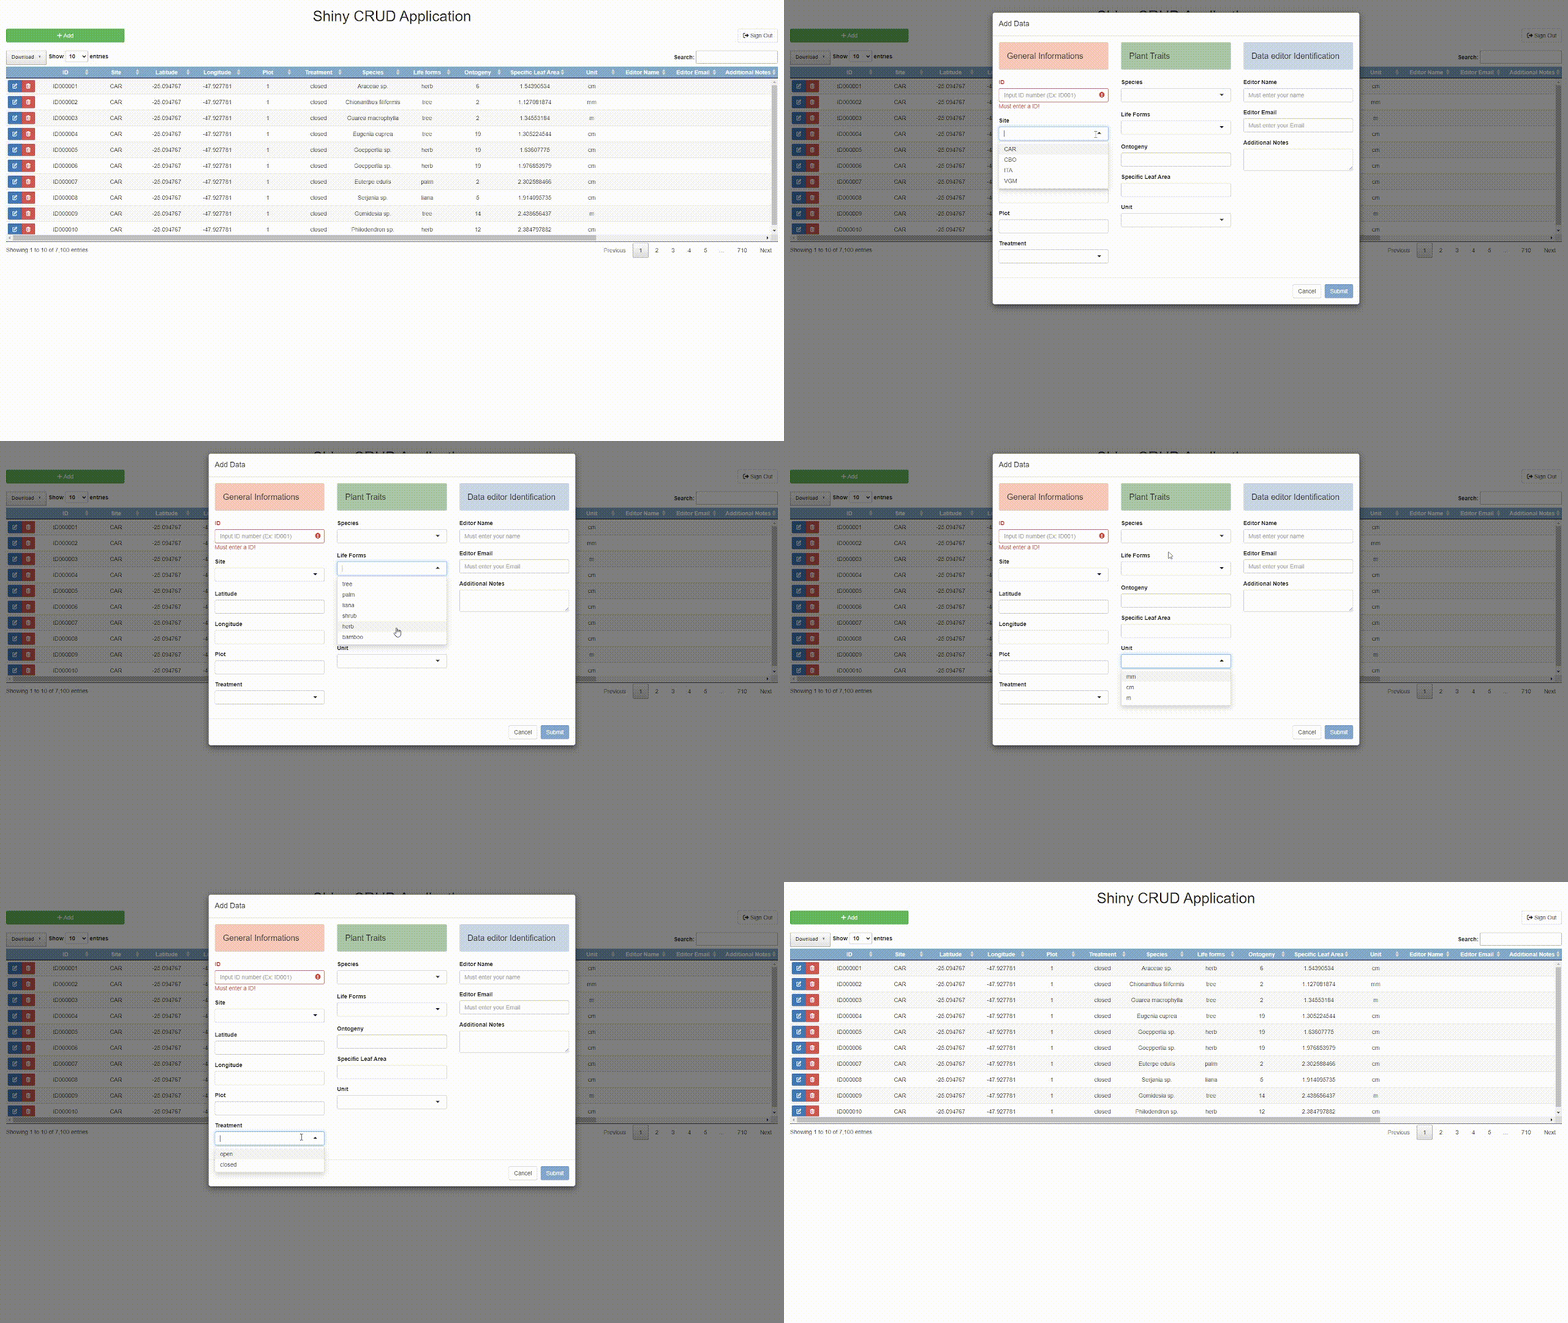
Building my 2nd ShinyApp
My second experience with Shiny was quite different and challenging. Here I created a CRUD app connected to SQL database management.

Building my 1st ShinyApp
This was my first experience building a ShinyApp. I created this app to host the dataset I used during my master's.